Last year’s IPA Effectiveness Awards Grand Prix-winner reveals a gap in how we measure advertising payback, sparking a re-think of how we pitch for budget.
2024’s IPA Effectiveness Awards represented significant progress in evidencing the relationship between advertising and pricing power.
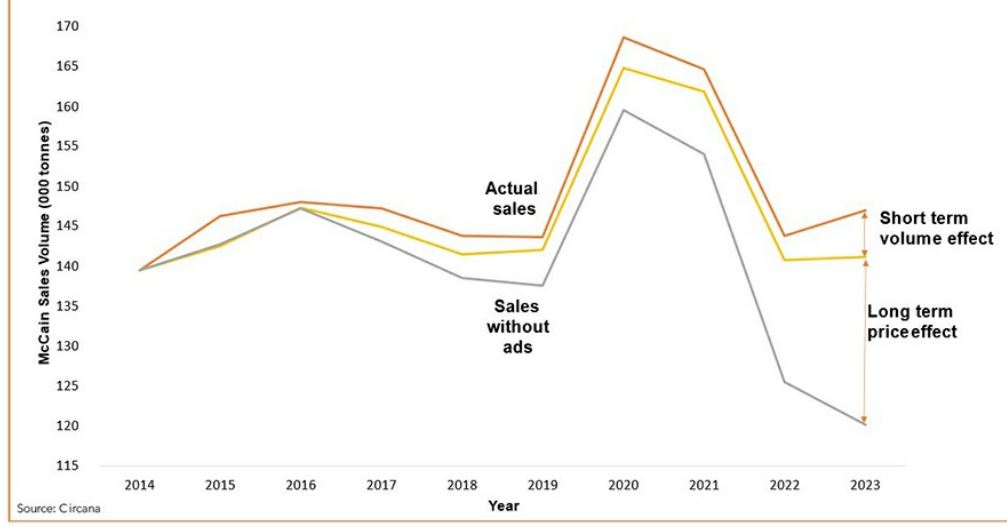
The results of the 2024 Grand Prix-winning paper from McCain show that by the end of a 10-year campaign, McCain’s advertising had created an effect on the brand’s pricing roughly five times bigger than the effect on its sales volumes.
Advertising’s impact on McCain’s pricing exceeded its effect on sales volumes

Chart source: McCain IPA Effectiveness Awards Grand Prix 2024 paper.
The McCain case builds on the evidence from a 2018 Direct Line Group (DLG) paper covering three brands in the insurance group’s portfolio. The DLG paper, which won both IPA Gold and the Channon Prize for Best New Learning, demonstrated that 58% of the total advertising payback for the group’s Churchill brand came via a price premium vs. its lower equity sister brand, Privilege.
To meet the demands of an era of heightened accountability, we need to better marry analytical rigour with a complete theory of advertising payback; creating a framework that is replicable by all.
As billionaire investor Warren Buffet has said, “If you've got the power to raise prices without losing business to a competitor, you've got a very good business. And if you have to have a prayer session before raising the price by a tenth of a cent, then you've got a terrible business.”
Pricing power is a fundamental attribute of a successful business. And these papers are powerful evidence of how advertising contributes to this.
But brilliant as they are; they are rare natural experiments, evaluated after the fact.
DLG’s removal of advertising support for Privilege in 2012 and, in the McCain example, the onset of the cost-of-living crisis in 2021, created the conditions for each company to measure advertising’s impact on the pricing power of its brands and demonstrate how this passed through to profit.
Like IPA winners should, these papers stimulate brands and agencies to think differently about the business case for advertising. But on their own, they don’t change the formula on which it's built.
Brand budgets under pressure
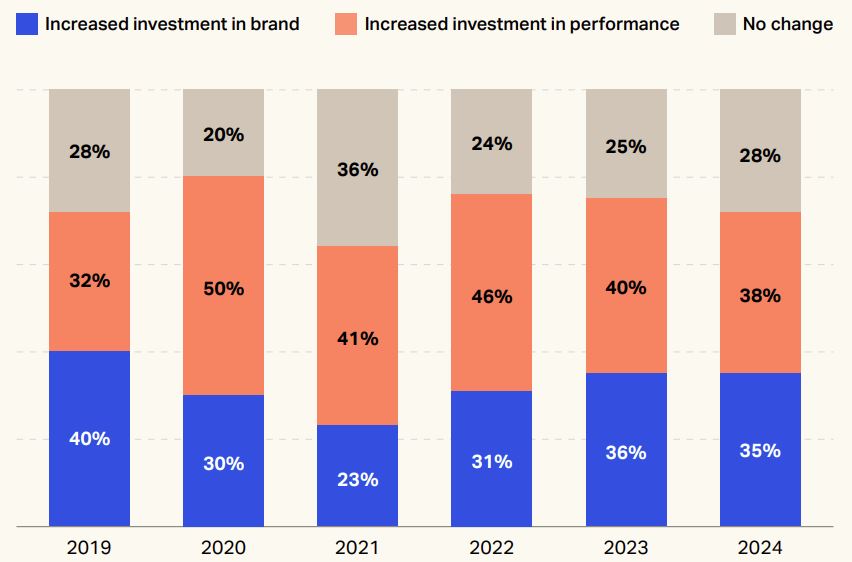
When we zoom out from the 27 winners of the 2024 IPA Effectiveness Awards to the industry at large, brand advertising budgets are highly pressured.
Performance budgets are more likely to be increased

Source: The Marketer’s Toolkit 2025, Warc
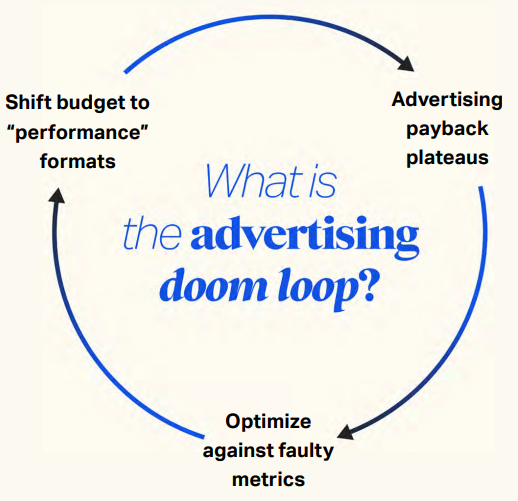
WARC’s recent ‘The Multiplier Effect’ summarises the challenge of today’s media effectiveness landscape and the impact of rising performance marketing spend. The report states: “The bias toward performance reflects a belief that this activity can easily be tied to commercial outcomes, as costs and returns are easily visible.”
Marketers can get caught in an ‘advertising doom loop’

Source: 'The Multiplier Effect', WARC, 2025
Brand spend, on the other hand, is harder to track through to outcomes. Effects are spread across multiple outcome metrics, unevenly distributed in time. The picture is further complicated by non-marketing drivers and the intermediate steps between exposure and conversion. This complexity creates uncertainty, often resulting in reduced brand investment.
For every McCain and every Churchill there are many more brands where incomplete measurement programs lure them into the ‘advertising doom loop’ described by WARC. They are unable to build the case for requisite brand investment from their board and begin a spiral where brand equity decay quickly turns to rising performance marketing acquisition costs and a less sustainable business.
'A complete theory from inadequate evidence'
Excess Share of Voice (ESOV) Theory has long supported brand and agency budget pitches. The theory that investing in sustained brand Share of Voice in excess of that same brand’s current Market Share leads to Market Share growth is well evidenced by academic papers, summarised brilliantly in Binet and Field’s IPA report, ‘Marketing in the Era of Accountability’ (2007).
But the technique lacks sufficient rigour to convince the finance teams of today.
ESOV is a single factor model addressing a multi-factor problem – the drivers of market share growth in a category. For the complex markets in which today’s brands compete and the fragmented media landscape in which they advertise, ESOV models do not meet the accountability standards that boards and investors require for investment decisions. Marketers need more sophisticated solutions to support their investment cases.
Market Share growth, while a blunt instrument, represents a fairly complete theory of advertising payback. But the challenge of replicating the findings with today’s data means marketers need more sophisticated solutions to support investment cases.
'Adequate evidence from an incomplete theory'
At the other end of the spectrum, Marketing Mix Modelling (MMM) solves the multi-factor problem with rigour and confidence, delivering granular forecasts of advertising payback tailored at the brand level.
But too often, these models represent too narrow a view of the value created by advertising.
For evidence of this, look no further than the McCain paper. It’s a phenomenal demonstration of the mechanics of advertising payback for FMCG brands. To reiterate, the pricing effect of McCain advertising was worth five times the volume effect after the cost of living crisis hit. With a total Profit ROI of £1.48 over a 10 year campaign, the pricing power effect of advertising unquestionably did the heavy lifting on payback.
Special effectiveness cases require special models
The crucial detail here is that the pricing effect reported in the McCain paper wasn’t derived from anything like a conventional MMM model. Nor was Churchill’s pricing power effect in the DLG paper. Both papers support IPA-winning advertising because they depart from the conventional approach.
Most MMMs are built at a brand level using three years' worth of historic data. This approach supports faster model delivery and deeper insight into more recent performance; but hides the effect of advertising on slower-moving, comparative factors like pricing power.
By contrast, the analytics company Circana built a custom 10-year model for McCain, using a longer time period to observe sales response to significant change in brand equity and the economic environment and tracing the improvement in the brand’s price elasticity back to its advertising.
Likewise, the DLG paper relies on a bespoke, comparative model built by Ebiquity. It combined granular CRM and Price Comparison Website data for DLG’s Churchill and Privilege brands, isolating the impact of advertising and advertising-driven brand equity on the purchase price achieved.
'Zoom out' for a complete picture of advertising payback
Together, these papers reveal an important measurement gap. Their custom models measure payback effects that dwarf those of conventional, three-year brand level MMMs.
‘Zooming out’ to a longer time period or a brand’s position vs. competitors reveals the bigger payback picture that 99% of MMM programmes miss.
It’s well recognised that the value of a brand is built and harvested over decades; and that pricing power is achieved relative to available alternatives in the market. So, when these effects matter to a business, they should be reflected in its measurement programme and in its business case for advertising.
When the case stops at MMM, we are often only half-way to an accurate forecast.
McCain and Churchill developed a solution for these gaps by elevating their MMM programmes, but similar benefits can be achieved with less complexity.
Fill in the gaps in models with other analysis and experiments
The most important step is to recognise what the MMMs don’t know and supplement the models with other datasets and forms of analysis to fill the gaps.
Brand equity, price elasticity and distribution power are generally ‘sticky’ factors at the brand level. They rarely move significantly over the course of an advertising campaign but often move profoundly with advertising strategy in the longer cycles that MMMs miss.
Market level analysis helps to quantify these missing factors. Comparative analysis across brand equity measures, customer metrics, availability, market share and media investment data creates a richer dataset from which to model different advertising payback scenarios. The position of market leaders can represent tangible headroom for other brands' growth, and more commoditised alternatives at the bottom of the market can help to triangulate the cost to a brand of going dark on advertising.
Adding new dimensions to advertising and outcome data can help quantify these missing factors too. Granular geographic data can identify groups that have been systematically over/under exposed to a brand’s advertising and can help to isolate the demographic data that accelerates or inhibits advertising effectiveness.
Experiments also have an important role by providing an alternative to the rear-view mirror bias of MMM, and by helping marketers size up the opportunity of new potential growth levers.
From campaign ROI to enterprise value contribution
Many have commented that the McCain case exists due to the brand being a private, family-run business, with freedom to plan for the long term. However, the Direct Line Group case shows that with the right tools, public companies can think in the same way.
This requires a pivot from seeing advertising as a volume driver to seeing advertising as an investment in margin growth, margin defence and the stability of sales.
A company’s enterprise value is derived not just from expectation of its future cashflows, but from the resilience of those same cashflows under different market conditions.
Advertising-driven pricing power is an insurance policy that allows brands to shift when the market shifts. Strengthening or maintaining position during periods of cost inflation or buying time to recover from disruptive innovation by a competitor.
2026 and beyond
Our industry has made progress by building granular, statistically confident brand level forecasts of advertising payback via MMM; but the McCain and Churchill cases remind us of the significant blindspots of these models.
To meet the demands of an era of heightened accountability, we need to better marry analytical rigour with a complete theory of advertising payback; creating a framework that is replicable by all.
Progress over the next awards cycle would involve pricing power moving from brilliant but outlying individual papers to forming a routine part of the ROI calculation for the entrants at large.
Billy Ryan is Head of Analytics and Effectiveness at the7stars.
Explore IPA Effectiveness resources
The opinions expressed here are those of the authors and were submitted in accordance with the IPA terms and conditions regarding the uploading and contribution of content to the IPA newsletters, IPA website, or other IPA media, and should not be interpreted as representing the opinion of the IPA.


